

Running a website and creating content without using analytics is like driving blindfolded. Even if something gives you great results, you probably won’t be able to replicate it as you don’t know the exact steps that took you there.
Web analytics platforms can help you:
- Analyze user behavior and how they navigate your website
- Understand where your web traffic comes from
- Measure the concrete results of your content
And finally, use these insights to optimize your website and improve both user experience and your conversion rates.
For many people, Google Analytics is the first website analytics tool that comes to mind, but that doesn’t necessarily mean that it’s the best, especially after the 2023 update, when many features and metrics have changed.
What’s more, nowadays, there are plenty of web analytics tools specialized for different purposes, like heatmaps or tracking the customer journey.
In this article, I’ve reviewed five such tools to help you find the right website analytics software for your particular needs.
Top five website analytics software in 2024
For this review, I focused on finding the best web analytics tools and comparing them in terms of their strongest features, user interface, rating and value for money.
1. Microanalytics
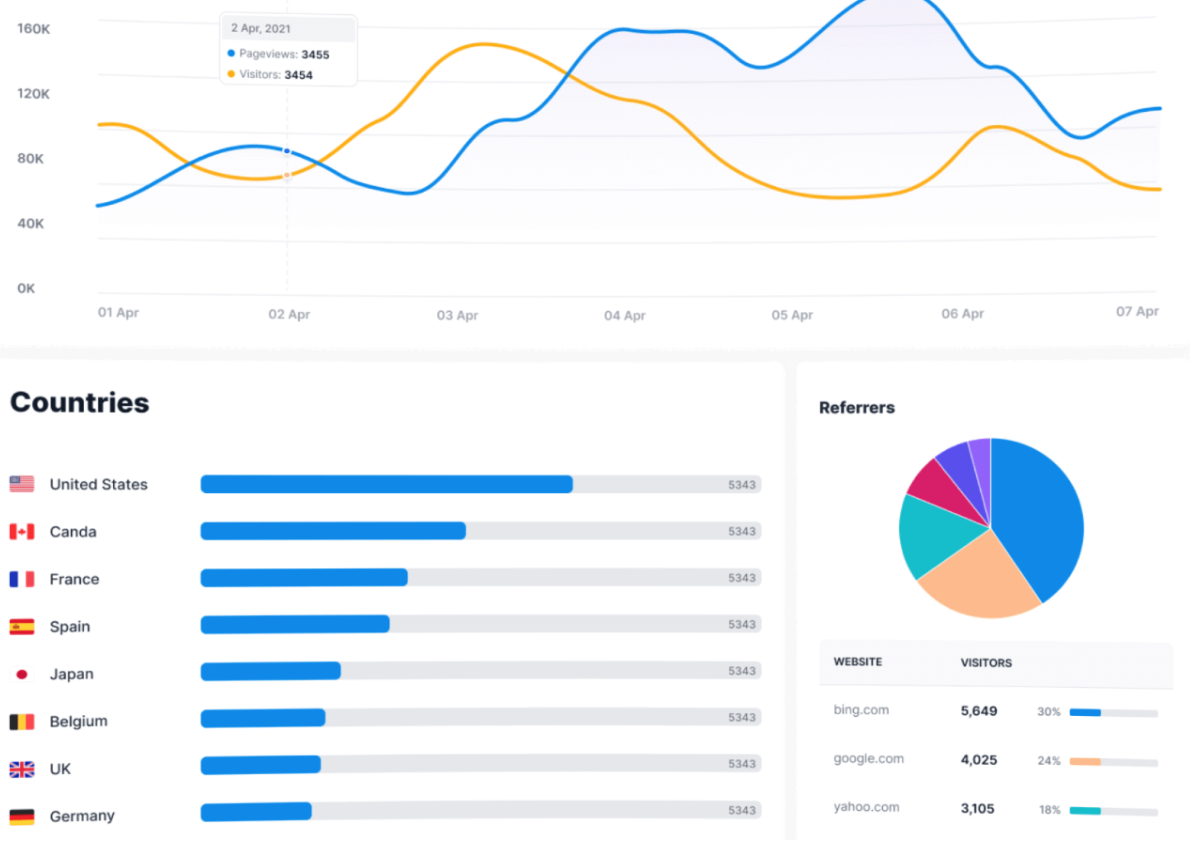
Microanalytics is a user-friendly and cookie-free web analytics tool, suitable for users who are looking for a comprehensive tool with similar features as the old Google Analytics.
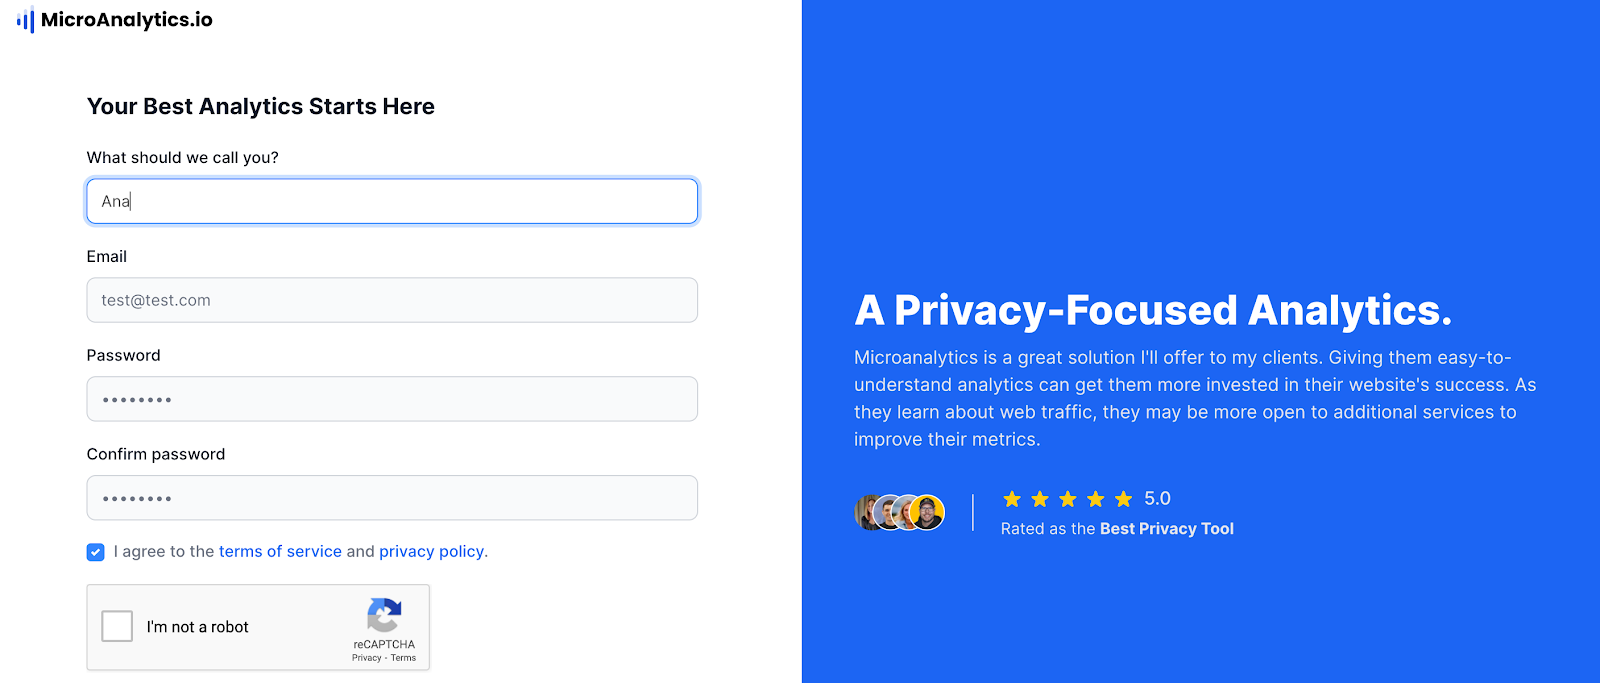
With a free plan, real-time tracking and, 2K users, and supreme online security, there isn’t a reason not to try Microanalytics.
Features
Here are its key features:
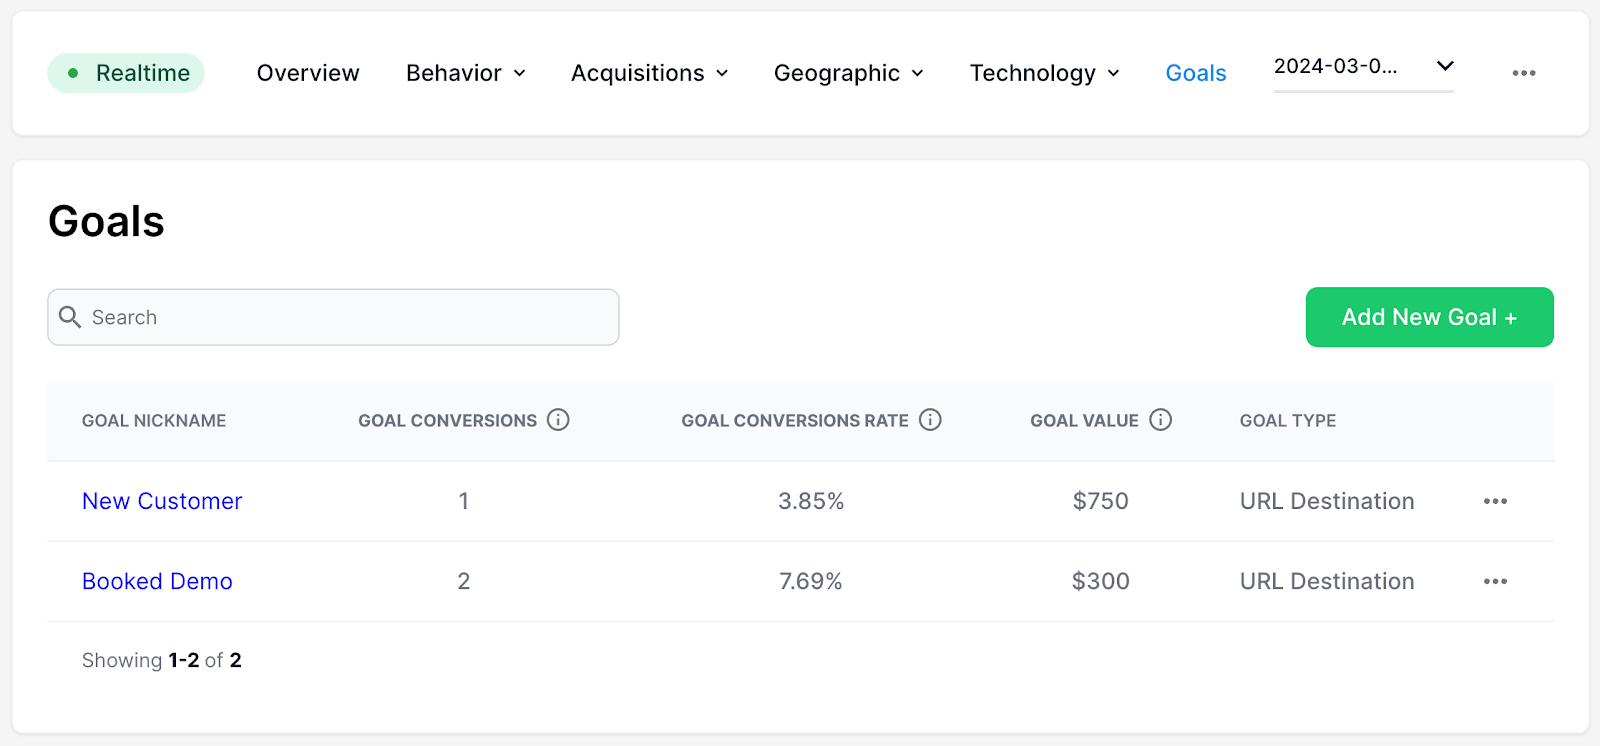
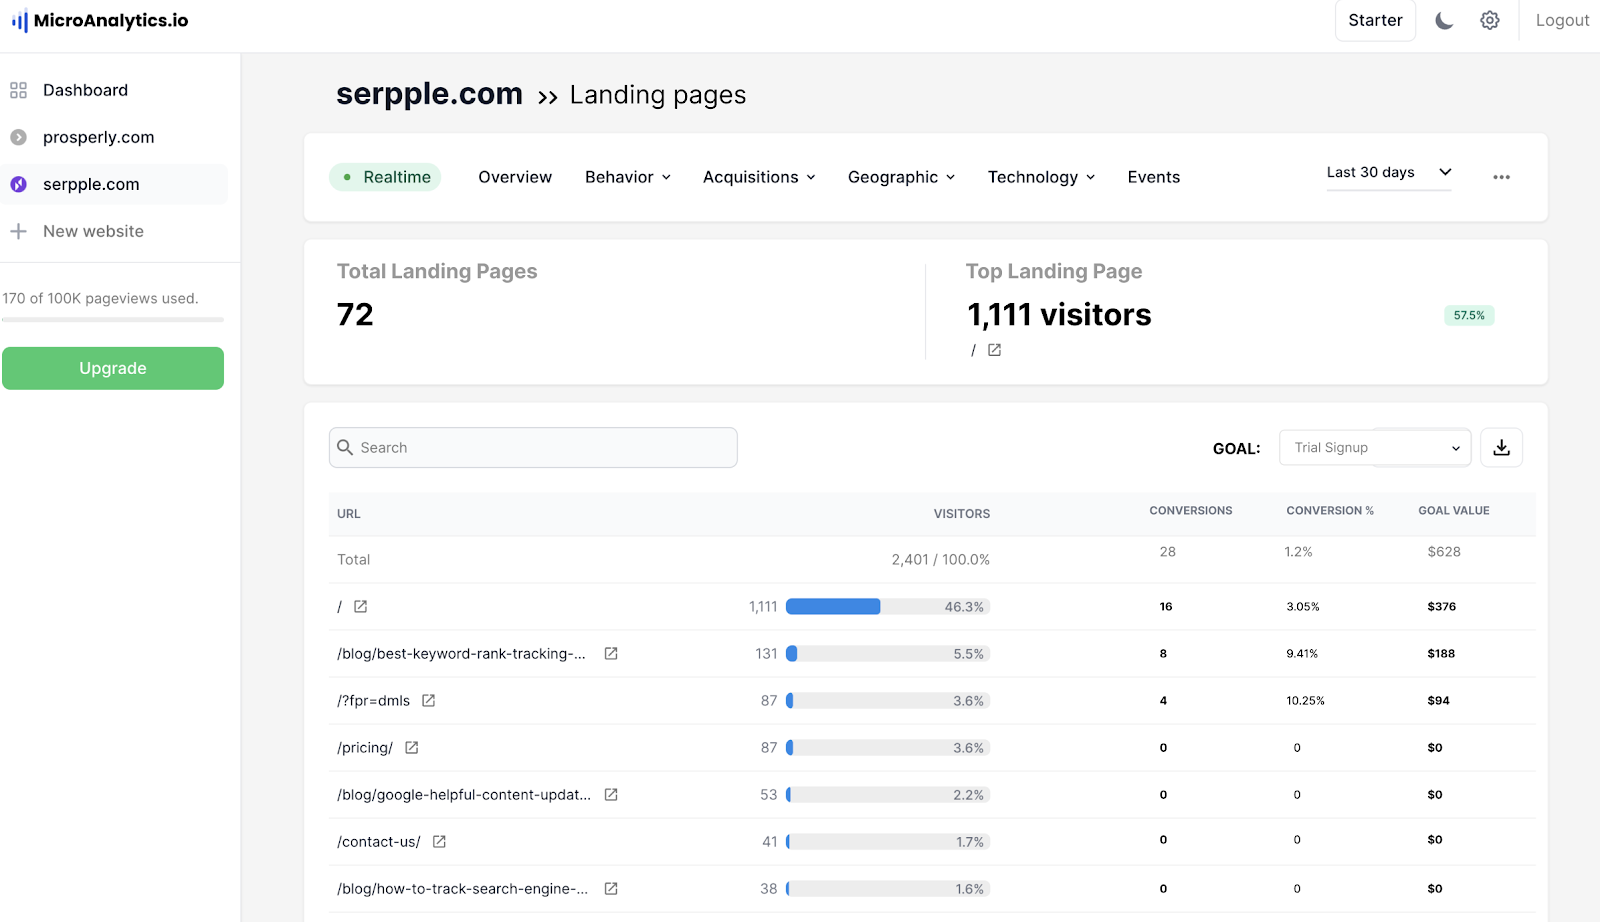
- Goal tracking: If you’re nostalgic for the good old days of Google Analytics and its conversion goals, where you could easily track where your website conversions were coming from, then you’ll love our goal-based analytics platform. It provides the closest experience to the old GA you can find today. Plus, you’ve got all the freedom to customize your goals just the way you like – add different types, set values, tweak conversion rates and much more.
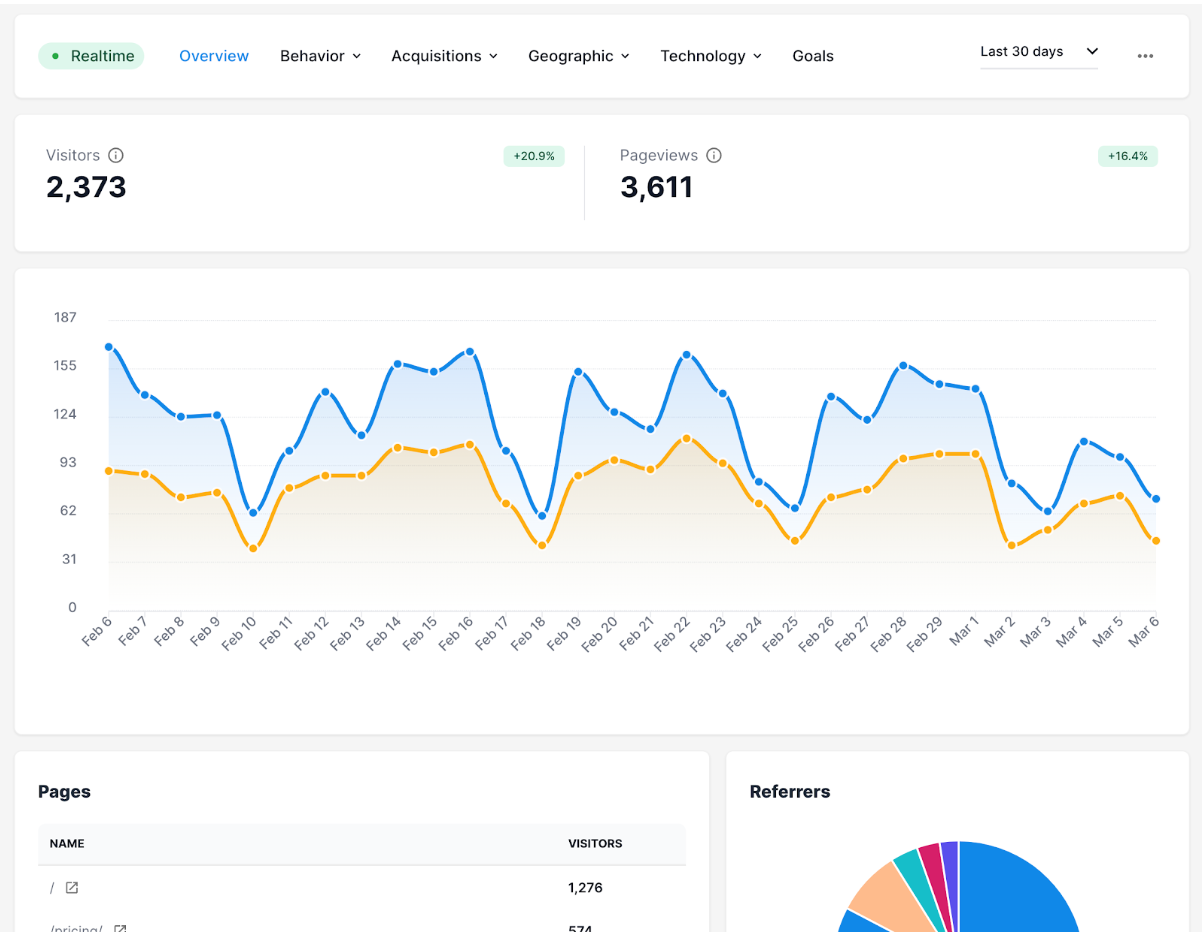
- Behavior, location and technology breakdown: You can track user actions, pinpoint their locations and identify the devices they use (mobile, tablet or web).
- Online security and privacy: Microanalytics doesn’t track users’ IP addresses, cookies or fingerprints, ensuring anonymity and compliance with GDPR, PECR and CCPA regulations. We guarantee complete control over your data, as we do not share it with any third parties.
- Data exportations: You can easily export your data to CSV format within seconds, so you can access them offline, whenever and wherever. You can also set period email reports.
- Fast loading time: Unlike many traditional web analytics tools, Microanalytics won’t slow down your website’s loading speed or affect your SEO. All possible due to our script that is 50 times smaller compared to Google Analytics tag and no cookies.
- Integrations: Microanalytics offers integrations with multiple tools, such as WordPress, Squarespace, Ghost, Wix, Framer, Webflow and Weebly, allowing you to visualize multiple data sources into a single dashboard.
And the best part is that you can use Microanalytics completely for free. Here’s how to get started:
-
Click here and register for free (there are no hidden costs).
-
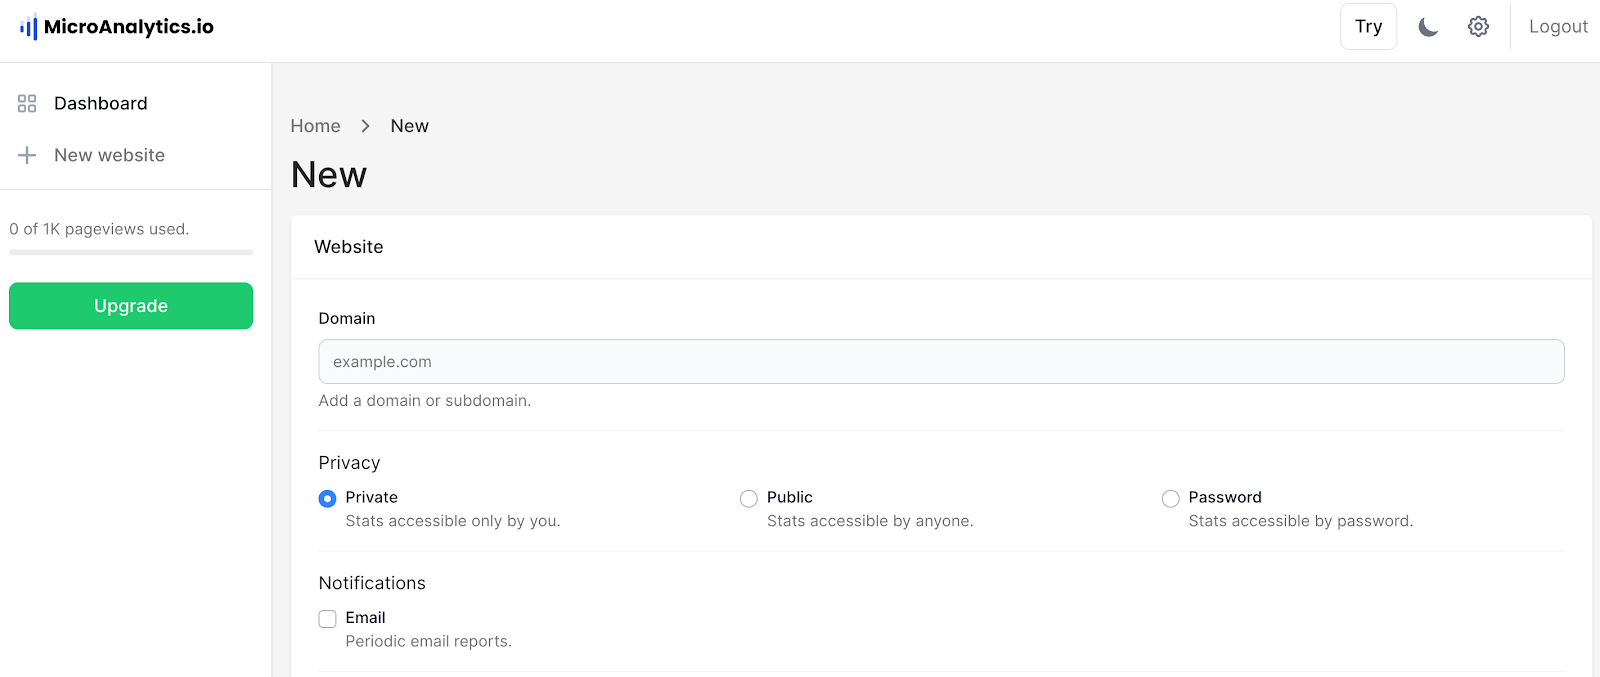
Add your website, then navigate to your site and insert a single line of code into your header (you’ll see it on the screen below, just simply scroll down).
-
Set your goals by adding a new event with our JavaScript. Some common goals are “new customers” or “booked demo”.
-
And there you go! Now you are equipped to analyze your traffic using our website analytics dashboards. Check your goal conversion rate, visitors, or any real time data easily.
UI/UX
Microanalytics is one of the best website analytics tools in terms of user-friendly and intuitive interface, making it suitable both for beginners and professionals alike. Also, its clear dashboards and reports show data in a comprehensible and clear way.
Pros
- User-friendly and intuitive interface
- Customizable goals feature
- Email reports
- Free plan
- Compliant with all privacy laws and regulations
- Tracking without cookies
Pricing
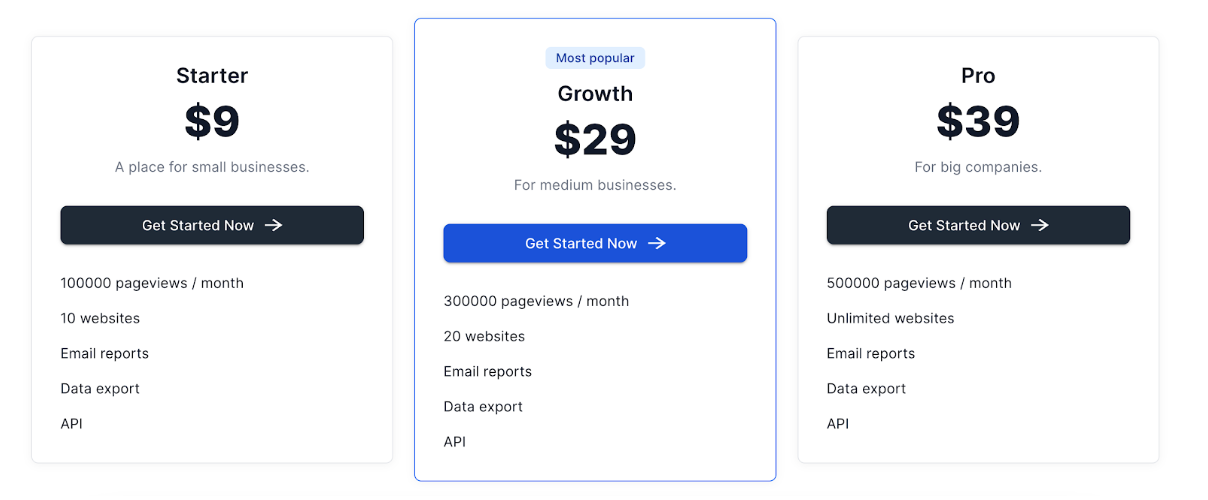
- Free plan: one website, 1000 page views per month
- Starter plan: $9 per month (great for smaller businesses)
- Growth plan: $29 per month (great for medium-sized businesses)
- Pro plan: $39 per month (great for big companies and large enterprises)
*If you choose for annual billing, you’ll get a 17% discount.
User ratings
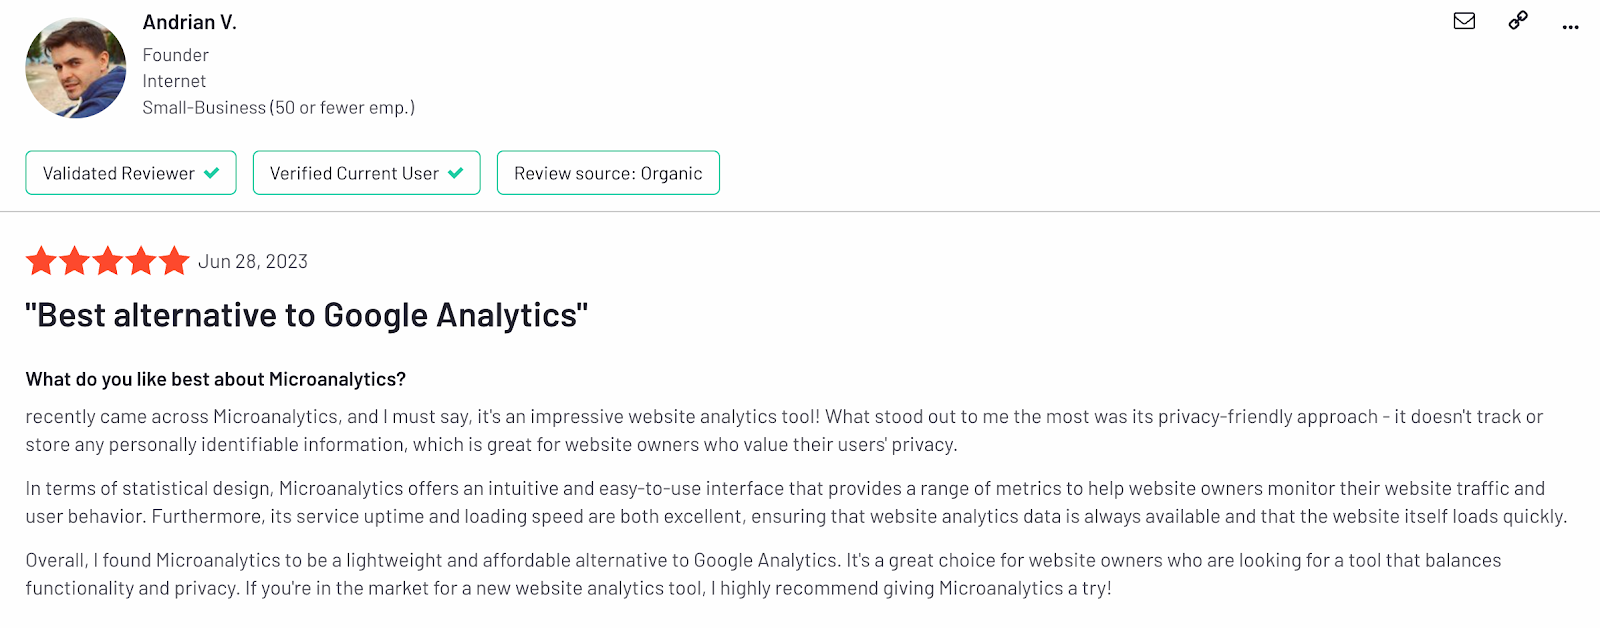
According to many users, Microanalytics is the most comprehensive yet user-friendly alternative to Google Analytics. They particularly liked its detailed tracking and privacy standards.
- G2: 4.8
2. Hotjar
Source: Capterra.com
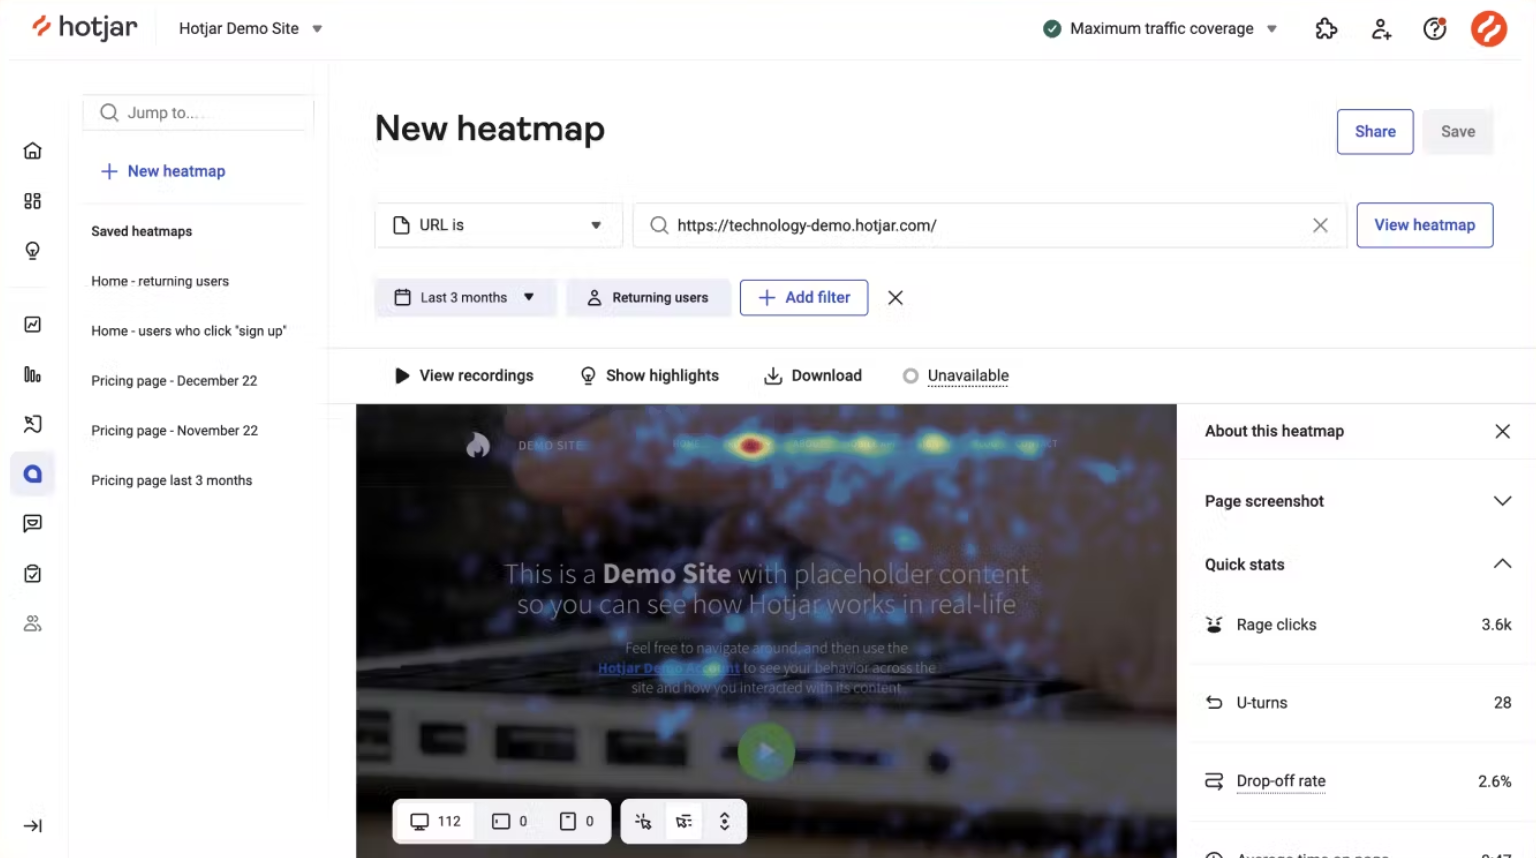
Hotjar is a visual web analytics tool used for analyzing user behavior through features like heatmaps, session recordings, user surveys and feedback. It lets you see firsthand how the visitors interact with your website and understand their paths. It’s popular among UX designers when they want to test multiple versions of website design.
Features
Here are its key features:
- Heatmaps: This feature functions as a tracker for your users, showing you how they move, what they click on, and what they scroll through. You can also see what interests them the most and what they completely skip.
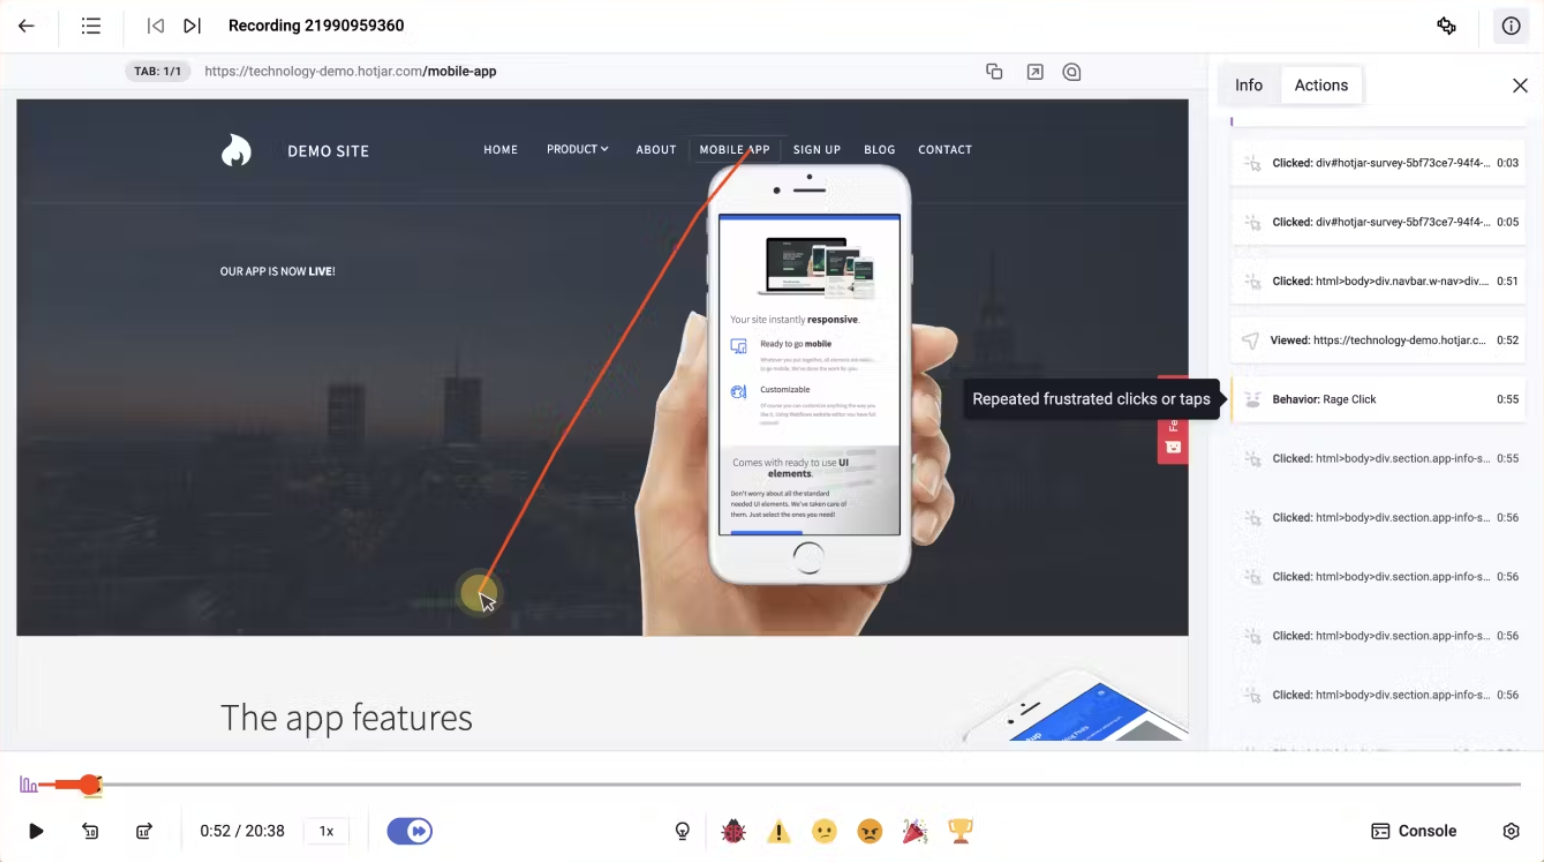
- Recordings: With this feature, you can see your website through your visitors’ eyes exactly as they see it. This unique view helps you spot certain issues and bugs and removes friction that prevents your users from finding what they want.
- Feedback: Quick feedback allows you to interact with your potential customers as they’re navigating your website and potentially test new features and ask them to rate them.
- Surveys: Surveys can help you with product ideation and validation, and the best part is that the questions are AI-generated, so you can create unlimited surveys with only a few clicks.
- Integrations: Hotjar offers integrations with WordPress, Shopify, Google Tag Manager, Kajabi, ClickFunnels and different tools for collaboration and task management.
UI/UX
Hotjar is intuitive and easy to use, but I’d like more streamlined navigation. Some features are difficult to find, and you could potentially miss out on many great features if you don’t know exactly where they’re located.
Source: Capterra.com
Pros
- Real-time insight into customer activity
- Color-coded website analysis
- Seeing your website from customers’ perspective
Pricing
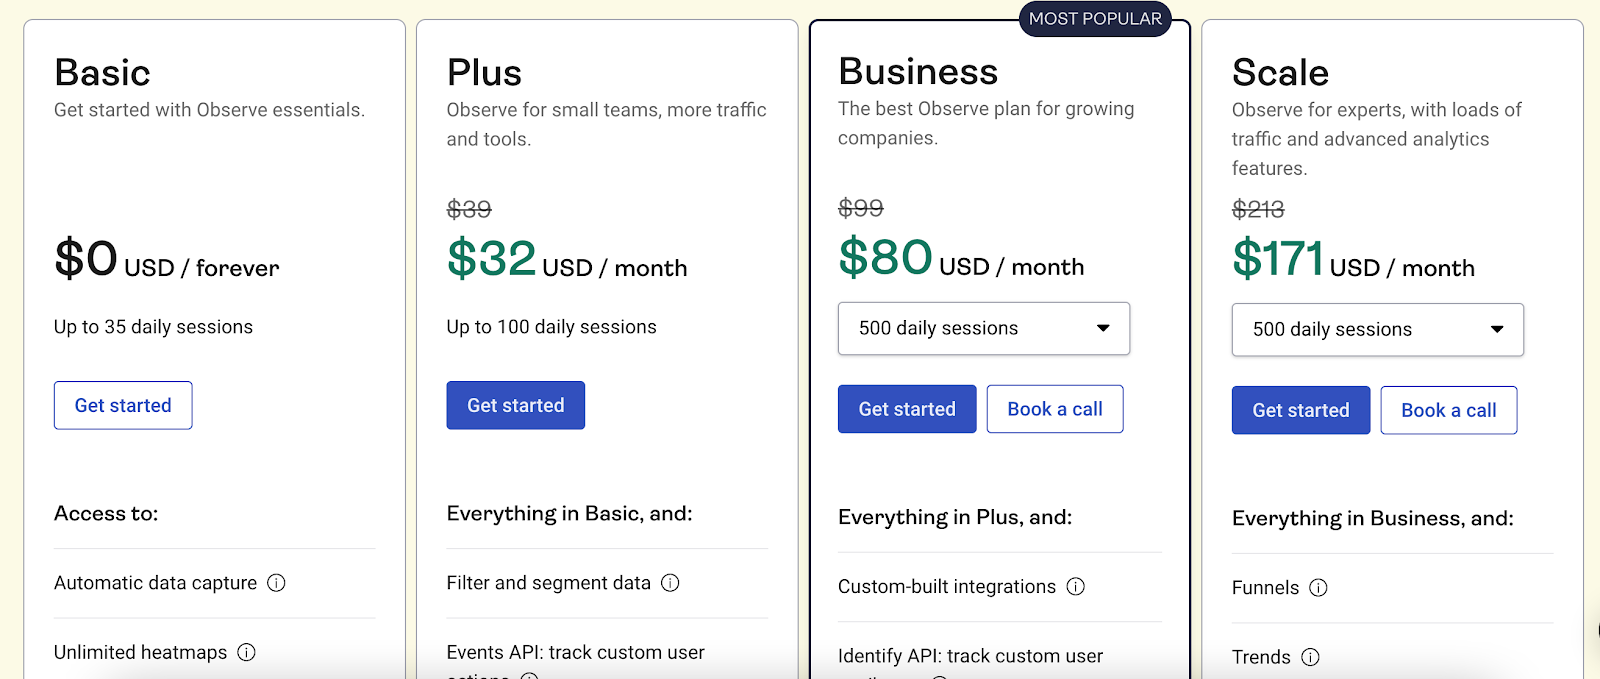
The most popular plan is Hotjar Observe*, which includes heatmaps and recordings. Here is its pricing:
- Basic plan: free forever
- Plus plan: starting at $39 per month
- Business plan: starting at $99
- Scale plan: starting at $213 per month
- Custom plan: custom price available upon request
There’s also a Hotjar Ask* plan that includes customer surveys and feedback and whose price is more or less similar to Hotjar Observe.
There’s also Hotjar Engage which focuses on user interviews and it’s free for up to three interviews a month, and then it costs start from $350.
Hotjar Observe and Hotjar Ask come with a 20% discount if you opt for annual payment.
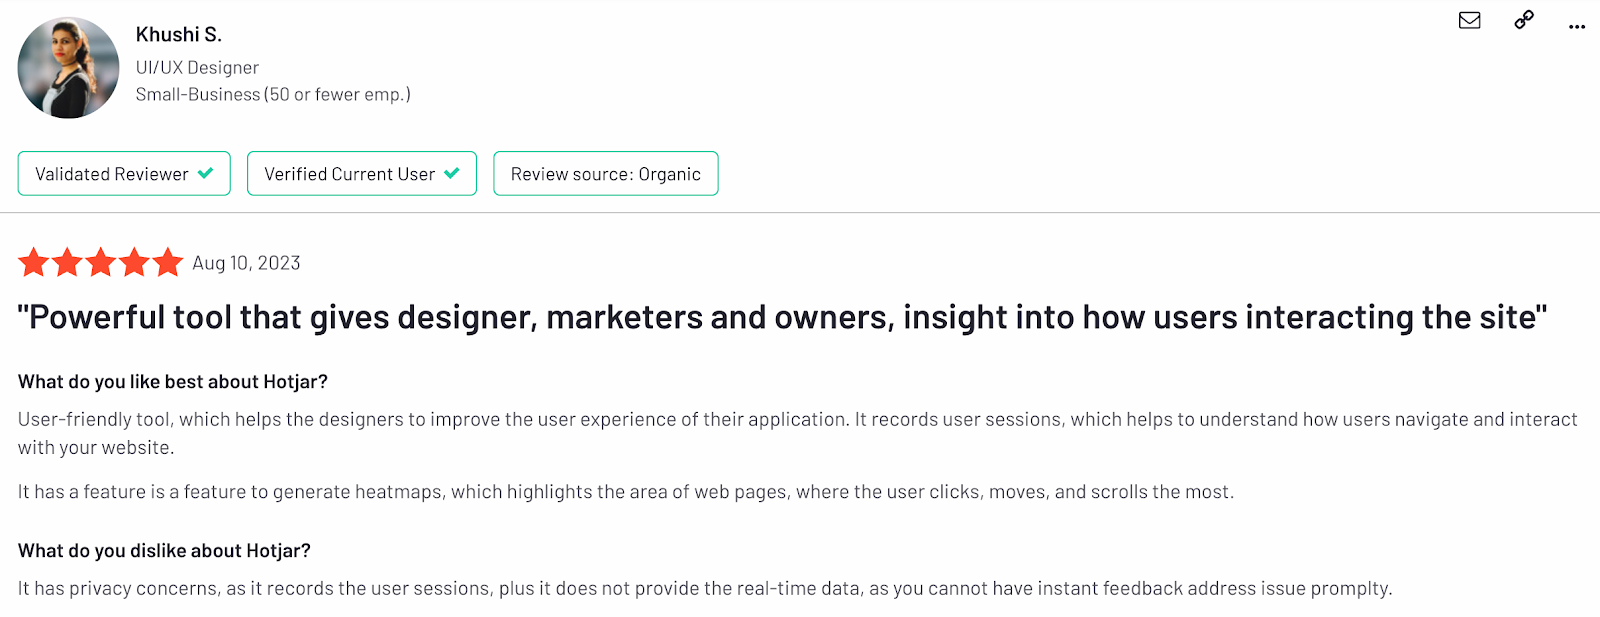
User ratings
Users find Hotjar an intuitive tool that provides valuable insights from the customer’s perspective, helping them understand what drives user behaviour. However, if you want to track traffic and other metrics, you’ll need to combine it with other web analytics software.
- Capterra: 4.7
- G2: 4.3
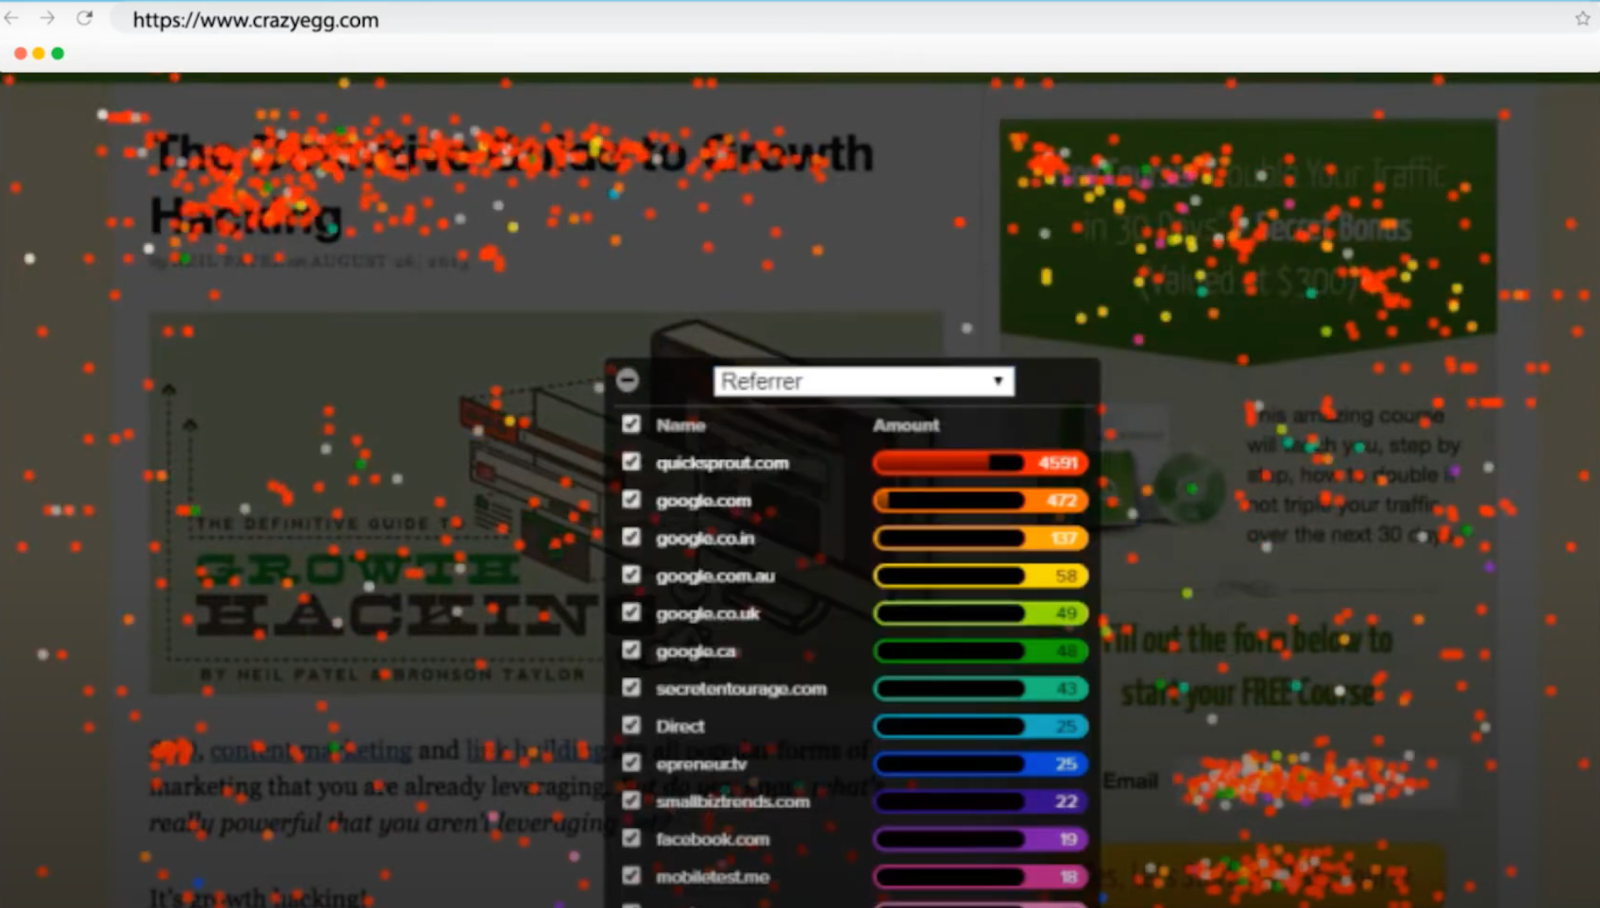
3. Crazy Egg

Source: Capterra.com
Crazy Egg is a tool similar to HotJar in terms of being focused on heatmaps and visual analytics, but the main difference is that Crazy Egg offers native A/B testing, while HotJar needs to rely on third-party integrations.
Features
Here are its key features:
- Recordings: You can view actual recordings of real visitors interacting with your website to gain insights into their behavior and understand what motivates or frustrates them. You can see where they go and how long they stay on your website.
- Snapshots: You can capture digital snapshots of your web pages and automatically generate reports showcasing the click behavior of your visitors.
- Errors tracking: Crazy Egg focuses on proactively looking for errors to fix on your website, such as non-responsive buttons, broken links, missing information or flawed JavaScript code, knowing that all these seemingly minor issues have a strong impact on user experience and conversion rates.
- A/B testing: With Crazy Egg, you can split-test almost all web page elements, from headlines to buttons. What’s more, built-in AI can generate multiple versions of copy to test.
- Integrations: The tool integrates with WordPress, Google Tag Manager, Shopify, Wix, Joomla and many more apps.
UI/UX
I like the fact that everything is color-coded and there are multiple ways to visualize data. However, I did find its interface a bit overwhelming at times as it requires a lot of zooming in to see the details.
Source: Capterra.com
Pros
- Proactive error-tracking
- Real-time A/B testing
- Automated reports
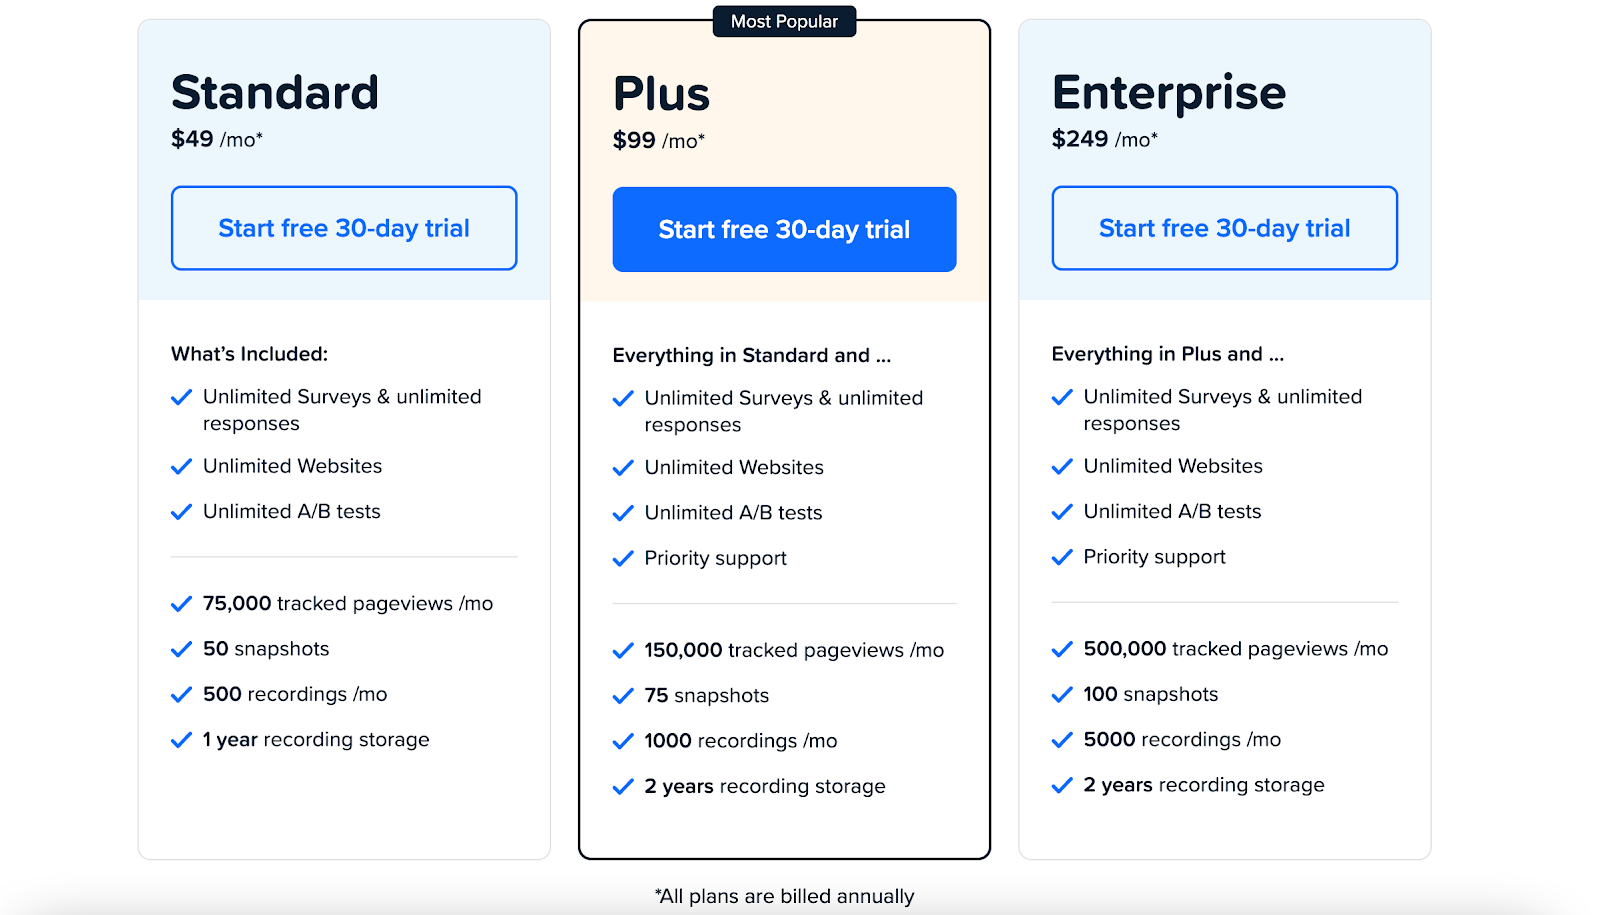
Pricing
- Standard plan: $49 per month
- Plus plan: $99 per month
- Enterprise plan: $249 per month
*All plans are build only annually.
User ratings
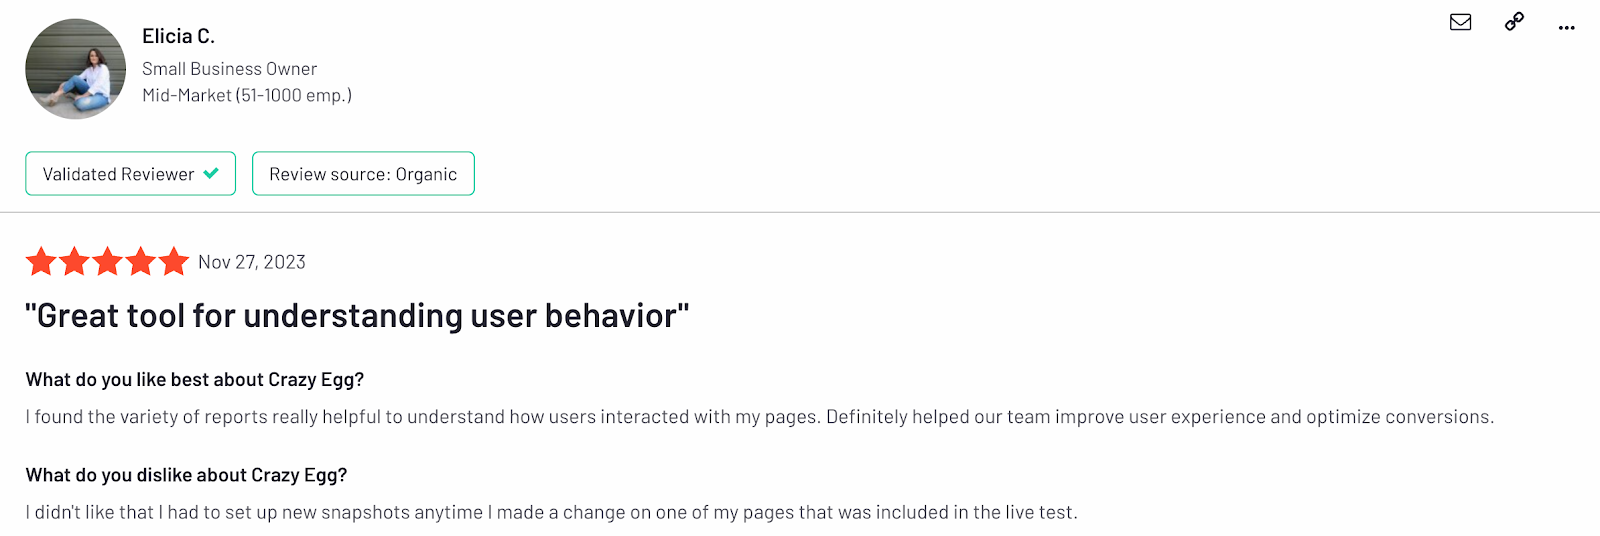
Many users claim that Crazy Egg has outstanding data visualization capabilities and A/B testing.
- Capterra: 4.5
- G2: 4.2
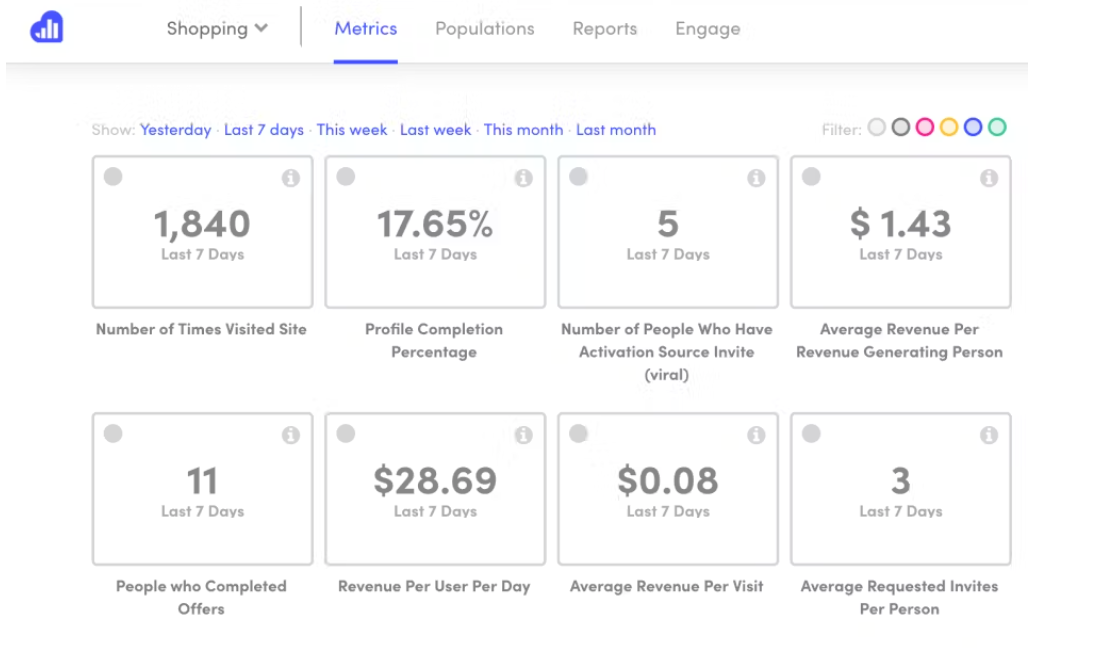
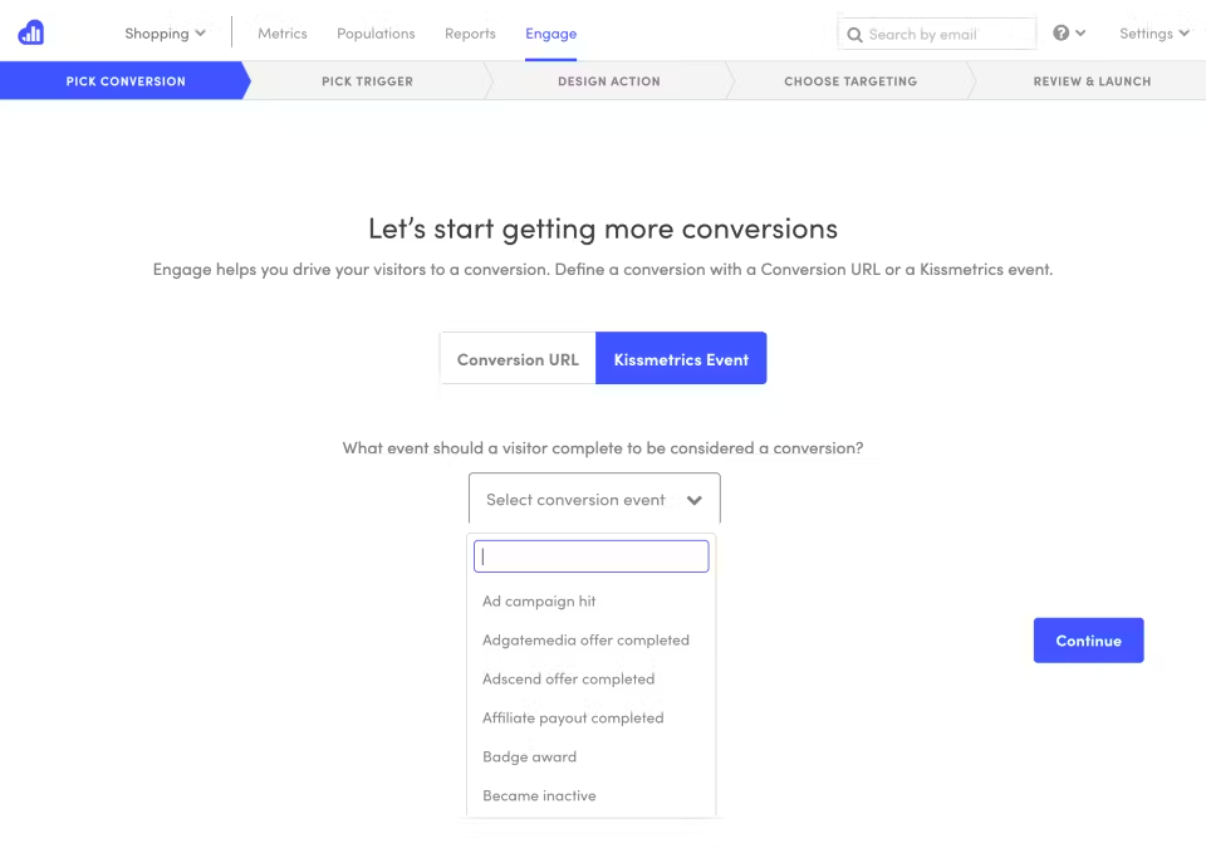
4. Kissmetrics
Source: Capterra.com
Kissmetrics is a marketing and product analytics tool that is most popular in the e-commerce industry when there’s a need to analyze large volumes of data systematically. It focuses on revenue-related metrics more than anything else.
Features
Here are its key features:
- Person-based approach: While traditional analytics tools are either session-based or pageview-based, Kissmetrics ties all the data collected to an actual person. It creates profiles of actual website visitors based on their previous interactions with your website and historical data.
- Funnel analysis: You can analyze your whole sales funnel to identify points of drop-off and friction so that you can optimize them and increase your sign-up and conversion rates.
- BI reporting: Thanks to this feature, you can browse raw customer data using SQL queries, analyze the ratio of Daily Active Users (DAU) to Monthly Active Users (MAU) and examine user behavior shortly after signing up.
- Multi-channel approach: This tool can analyze traffic from different marketing channels and multiple websites at the same time, and compare their performance.
- Integrations: Kissmetrics offers a variety of integrations, such as Zapier, HubSpot, WooCommerce, Shopify and different email marketing tools.
UI/UX
The user interface is simple and minimalistic, making it easy to navigate even when there’s a lot of data to visualize.
Source: Capterra.com
Pros
- Clean and straightforward data visualization
- Creating customer profiles
- Analyzing the whole sales funnel
Pricing
You can either create your custom plan or use the pay-as-you-go method, where you pay $0.0025 per event, ideal for those who are just starting out.

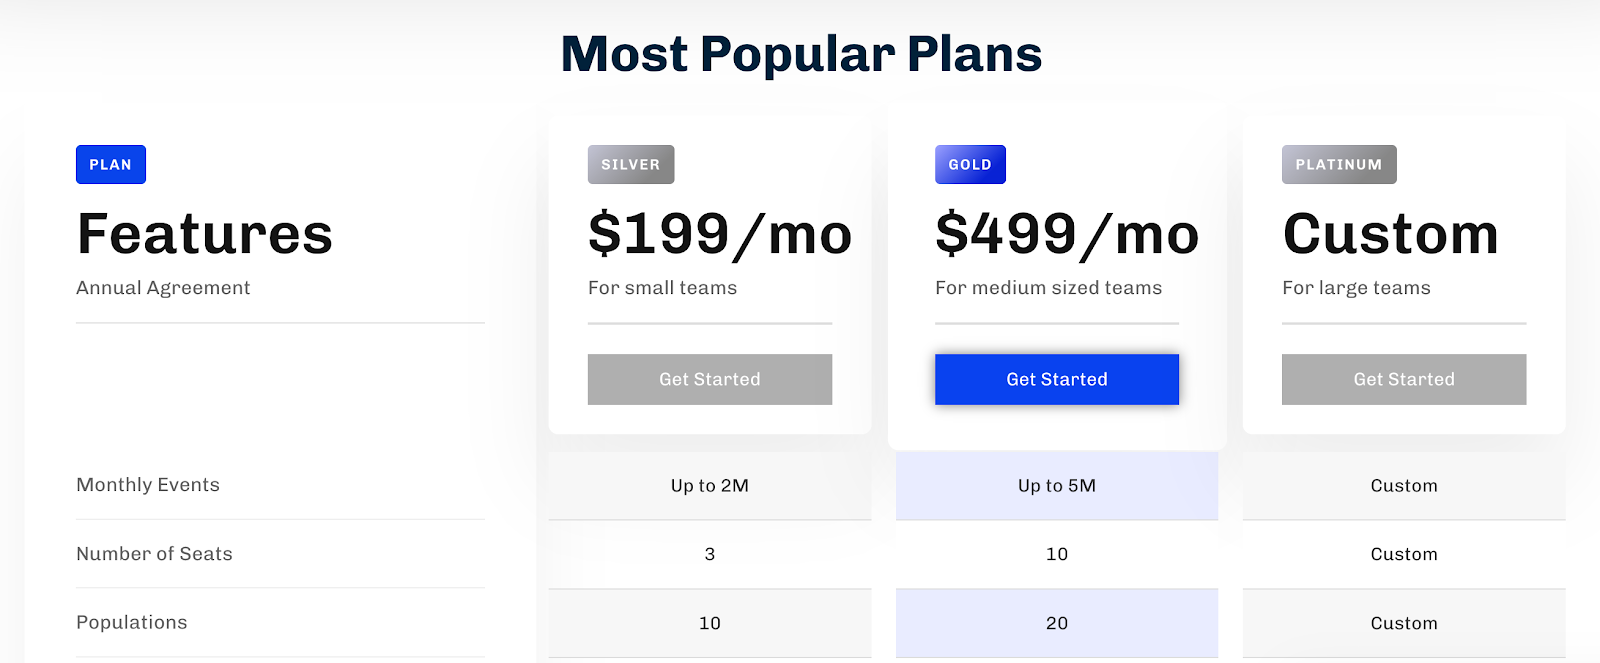
There are also three pre-made plans, based on the most popular options users were choosing:
- Silver plan: $199 per month, for small teams, up to 2M events
- Gold plan: $499 per month, for medium-sized teams, up to 5M events
- Platinum plan: custom price available upon request
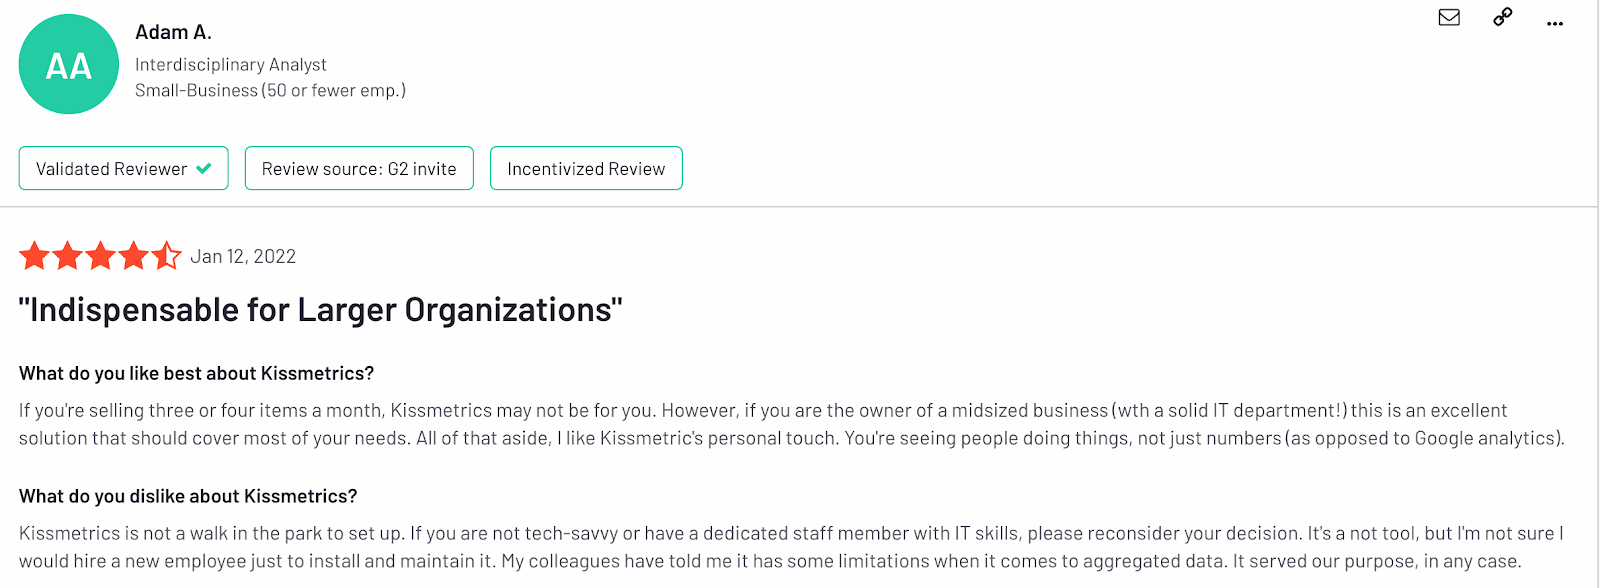
User ratings
Many users like Kissmetrics as it allows them to visualize both quantitative and qualitative data in an easy way.
- Capterra: 4.1
- G2: 4.1
5. Statcounter
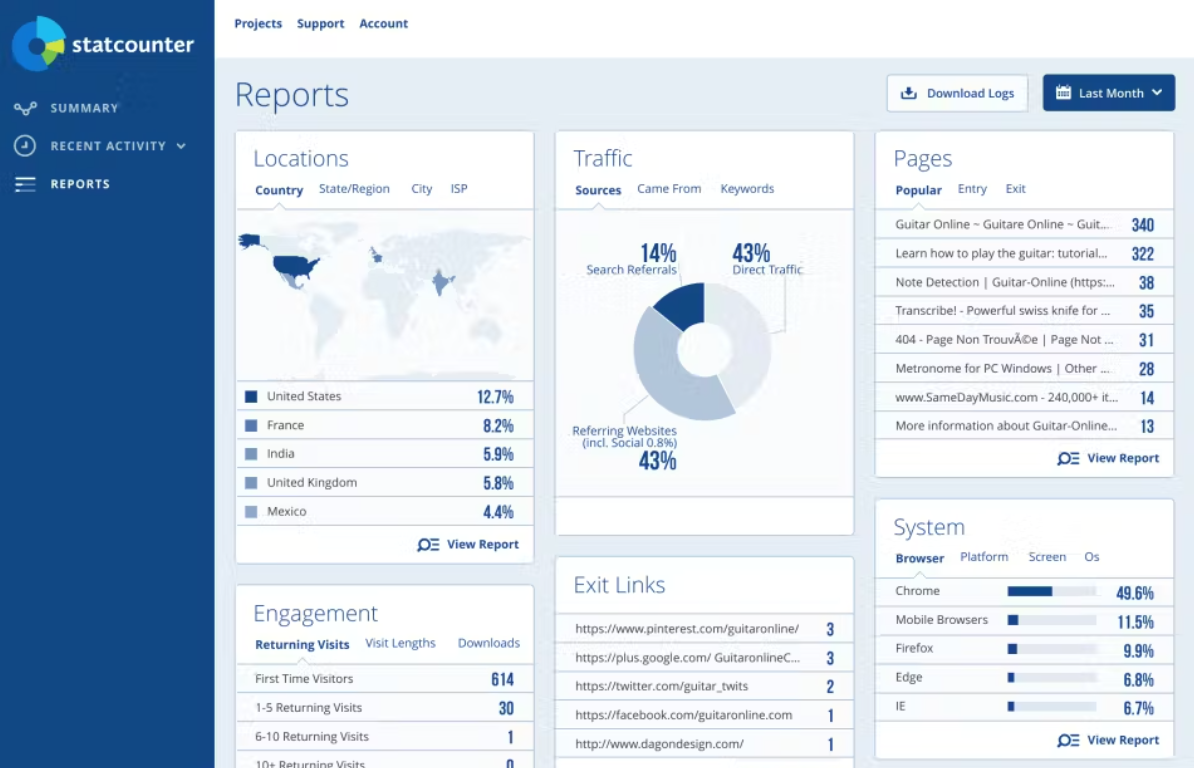
Source: Capterra.com
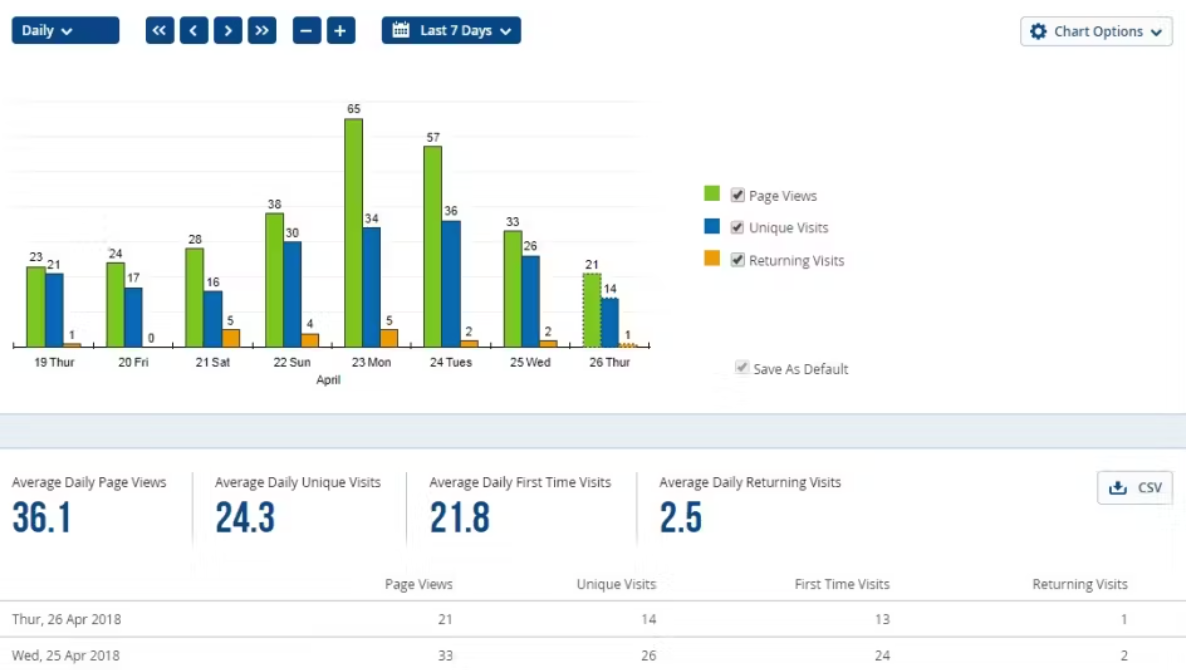
Statcounter is a tool that analyzes both organic and paid website traffic with a special focus on helping you detect click fraud and whether a website is down.
Features
Here are its key features:
- Conversion tracking: This metric particular to landing pages, shows you the exact percentage of visitors who successfully achieved your web page’s goal, whether to make a purchase or subscribe to your newsletter.
- Visitor paths: You get detailed maps based on the navigation paths your website visitors follow, helping you optimize your website for a better experience.
- Visitor alerts: You can receive notifications and alerts whenever a particular visitor returns to your website, so you never miss important visitors.
- Fraudulent click detection: You can discover the IP addresses repeatedly clicking on your ads and filter out fraudulent clicks, bots and click farms and use this report to ask Google Ads for a refund.
- Integrations: Its most valuable integration is with Google Ads, which reveals specific details for each visitor session, such as keywords, campaign, ad group, and location.
UI/UX
The user interface is easy to navigate, however, it’s a bit outdated compared to other popular web analytics tools and it might require previous experience.
Source: Capterra.com
Pros
- Covering all web analytics key metrics
- Real-time alerts
- Super safe
Pricing
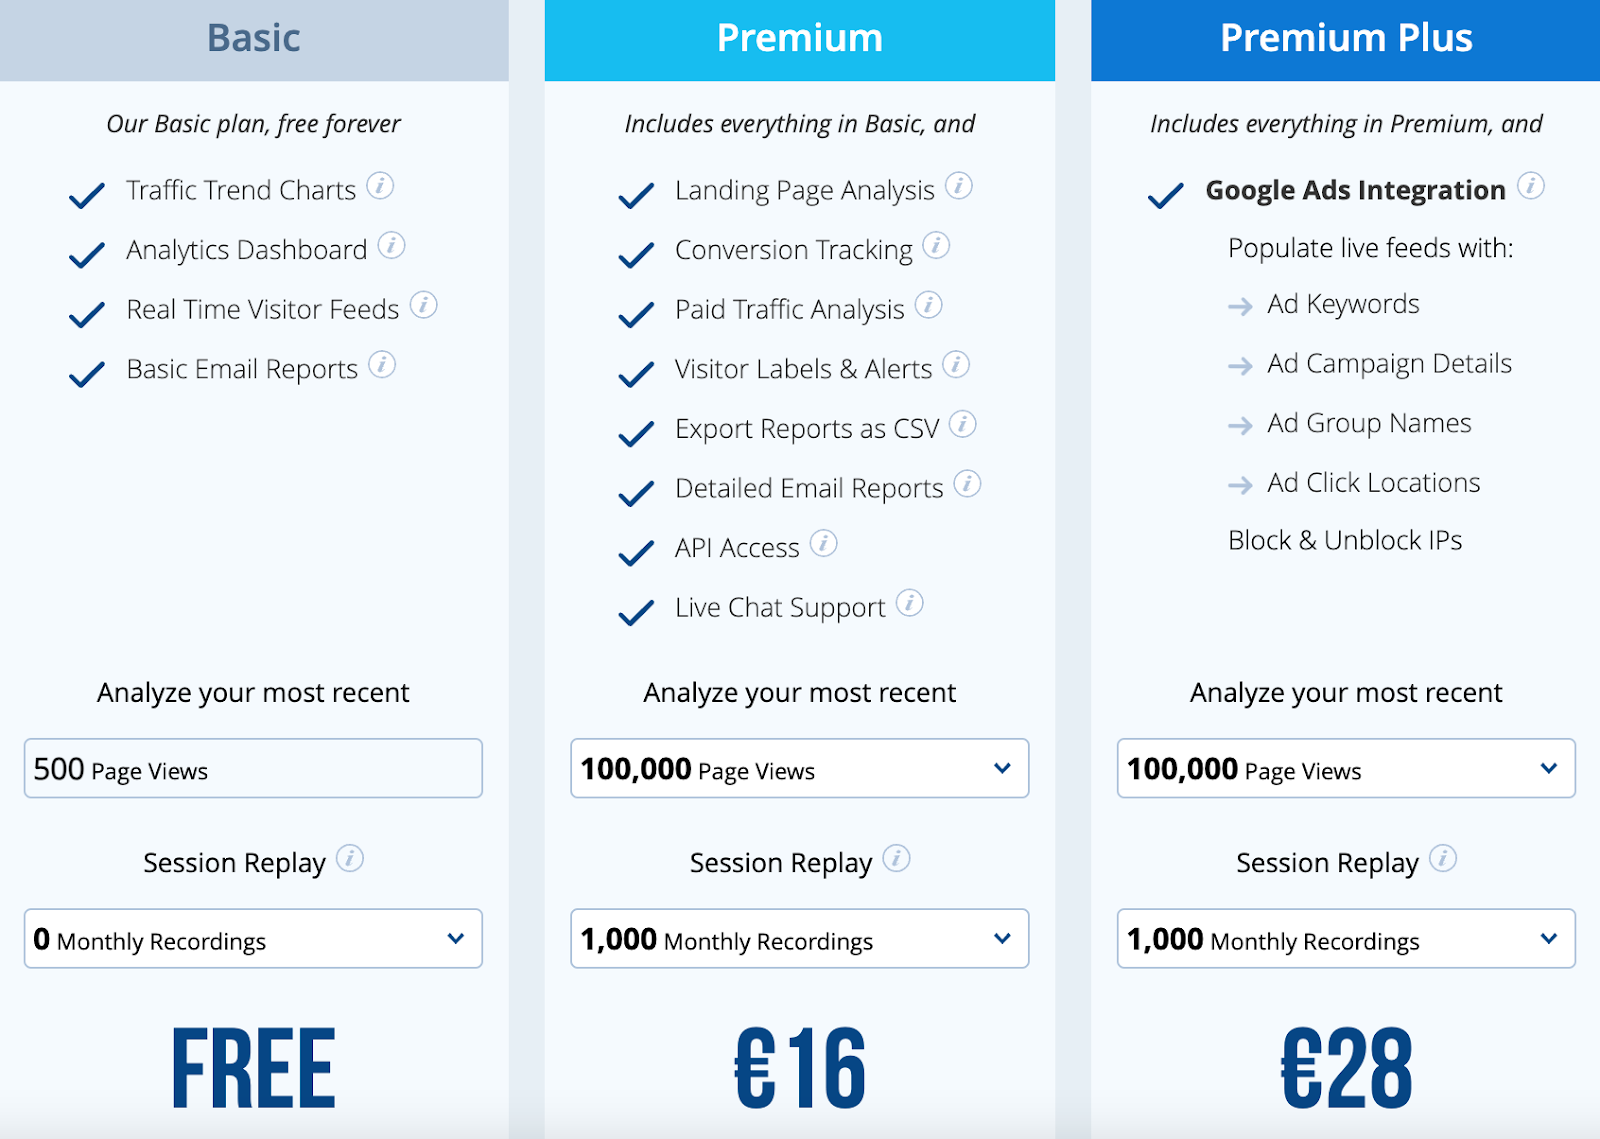
You can create your own plan based on the number of page views and session recordings you wish to access.
- Basic plan: free (without monthly recordings)
- Premium plan: starting from €16 per month
- Premium Plus plan: starting from €28 per month
User ratings
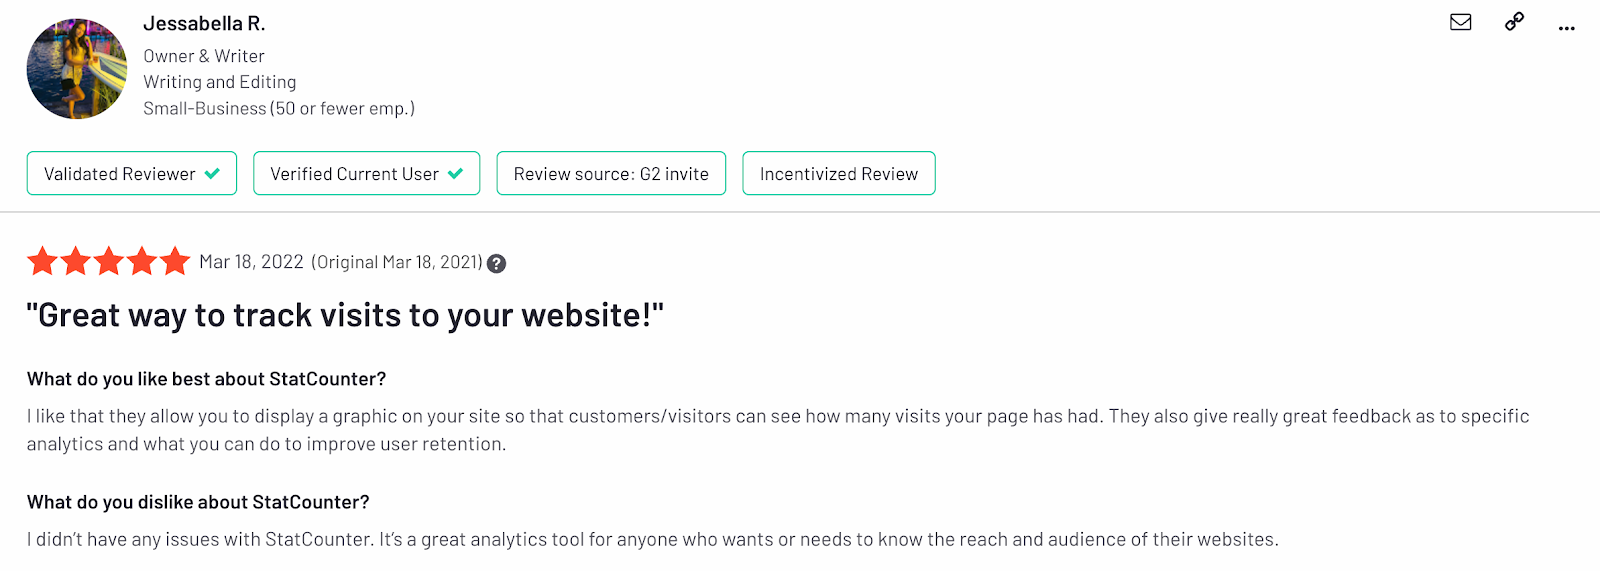
Users find this tool to be a stable and reliable one and they believe it offers great value for money.
- Capterra: 4.5
- G2: 4.3
What type of website analytics software do you need?
Here’s a quick recap of different types of web analytics software solutions to help you pick the right one for you:
- Universal web analytics tools: They track and analyze website traffic and user behavior and include different features and use cases. An example of such a tool is Microanalytics which acts as an umbrella tool for all other tools on this list.
- Heatmap tools: They visually analyze user behavior on your website, showing the parts where they spend the most time and the parts they scroll through without paying attention. Hotjar is a great example of a tool that creates color-coded heatmaps.
- User behavior analysis tools: They analyze customer behavior on your website spotting patterns and room for improvement. One of those tools is Crazy Egg which focuses on detecting and fixing errors on your website.
- eCommerce analytics tools: eCommerce tools like Kissmetric are designed to smoothly handle large amounts of data, with a special focus on revenue-relating metrics.
- Traffic analytics tools: Some tools focus on analyzing both organic and paid traffic and spotting fraudulent clicks and Statcounter is one of them.
Bonus tool: If you are a fan of AIl, check how to use ChatGPT to interpret analytics data.
Comparison table
| User-friendly | Data protection | Data exporting | Price | Best for | |
| Microanalytics | Extremely | Supreme | CSV format, with one click | Free plan Paid plans from $9 per month | Beginners and experts looking for a comprehensive web analytics tool |
| Hotjar | Good | Not great | Only through API | Free plan Paid plans from $39 per month | Heatmaps |
| Crazy Egg | Good | Not great | PDF format | Starting at $49 per month | Proactive error tracking and A/B tests |
| Kissmetrics | Good | Good | Multiple formats | Starting at $25.99 per month | E-commerce web analytics |
| Statcounter | Average | Great | CSV and Excel format | Free planPaid plans from €9 per month | Basic paid and organic traffic analytics |
Conclusion
There you have it! You now understand the key differences between Microanalytics and other website analytics tools.
I hope that this article provided you with the necessary knowledge to choose the most suitable one for you, whether you need a simple heatmap tracker or in-depth site analytics.
If you’re looking for an all-in-one web analytics tool, Microanalytics is just the thing you need. With all its advanced features and intuitive interface, it’s suitable for both beginners and pro analysts.
Its greatest advantage? It’s an entirely free web analytics tool! Register today and optimize your website to achieve your goals.
FAQs
Which web analytics tool is best?
Microanalytics is one of the best web analytics tools due to its precise tracking, supreme data protection and user-friendly approach that’s making it accessible to everyone.
What is a website analytics tool?
It’s a tool that’s used for web traffic analytics and tracking user behavior on your website. It can track different metrics and provide you with real time data on how customers interact with your website, helping you optimize it.
Is Google Analytics for website free?
There’s a free version of Google Analytics, but the tool is based on the freemium model, meaning that you’ll have to switch to a paid version if you want to access custom metrics or track more data.
How do I get analytics for my website?
Most web analytics tools work in a similar way: first, you need to create an account and connect the analytics platform with your website by adding tracking code to your headers. Then, choose the key metrics and goals, give it a little bit of time, and come back to analyze your reports.