Physical Address
304 North Cardinal St.
Dorchester Center, MA 02124
Physical Address
304 North Cardinal St.
Dorchester Center, MA 02124

There could mainly be two reasons why you’re searching for an article that helps you with real-time analysis for your website. First, you’ve just started a new website (or are responsible for managing one) and want to understand what/when/why/how visitors are interacting with it.
Or, you’ve done real-time traffic analysis in the past but failed to get the results you deserved and now looking to correct your past mistakes.
So, whether you fit in the first or fall in the second, we promise that by the time you’re done with this ultimate real-time traffic analysis guide, you would have a near-to-perfect grasp of the many concepts of web analytics to help you build your website and/or online business grow.
Let’s start scrolling down.
A note to the reader: you might come across instances where you would witness the terms “real-time traffic analysis” and “real-time analytics” being used interchangeably. Fear not, they are one and the same, both covered under the domain of web analytics.
If you already know what it means, feel free to jump to the next section. But to have everyone else on the same page, let’s deconstruct the term first.
Putting the above three together, real-time traffic analysis is the process of understanding the behaviour of your visitors “as they visit, interact, and leave” your website/application.
As to how you can achieve it, pay attention to the term “interact” in the last line. Visitor interaction here covers all of their acts like:
Short answer: any website that relies on customer profiling to sell better. It’s like having a supercharged spy mission (minus the malintent, because we know you’re a good person), happening right on your website! You’re (almost) Sherlock, peeking from behind the digital curtain to see what your visitors are up to, as it happens.
So, say, you own an e-commerce website, then you can use real-time traffic analysis to:
With all this knowledge, you’re not just sitting around twiddling your thumbs waiting for sales. Oh no, you’re watching every click, every scroll, every “add to cart” as it happens.
It’s like having a secret agent feeding you intel on which products are flying off the shelves and which ones are gathering dust.
Another example is news portals/blogs. They can leverage real-time traffic analysis to:
Having access to real-time data means you’re not simply publishing articles blindly and crossing your fingers for virality. Instead, you’re actively monitoring which stories are gaining traction and which ones are losing steam, allowing you to dynamically adjust your strategy based on audience engagement metrics.
We have already deconstructed the term “real-time traffic analysis” to get it better and understand its power. So by now, we know that whatever our visitors do on our platform, we will get to know about that. But that’s just “too much data” from “too many people”.
More the data, the more will be your mental exercise to make something out of it.
And even though in us we trust, why spend so much time looking at so much of it, when you can plan out well in advance what you are looking for? That way you can keep your analytics superpower focused on making something out of it.
That’s why picking out the right KPIs is crucial for making real-time analysis count.
Start by pinpointing what you want your website to achieve. Is it getting more sales, keeping folks more engaged, or just making their experience smoother?
Some usual KPIs that most marketers or analytics experts like to track are:
Other than these, demographics, technology (what devices visitors use), age, etc., are some markers that help you understand your user path analysis better.
Now, these are some KPIs that most analytics tools measure anyway, so you don’t have to do much in terms of setting up your system to track them.
What’s important for you is to understand that just because a KPI is there, it shouldn’t mean that you should start exporting them into Excel and crunch the numbers to make something out of it.
That brings us to the “how” part of choosing the right KPIs.
Assume you have an online shoe store for men and you sell across borders. Now, one might assume that if the store has been marketing itself as “for men”, there is not much use looking into the gender-based demographics reports, right?
Well, you can’t be further from the truth. Because although you have niched down to selling your shoes to men and calling them your “user”, it doesn’t necessarily mean that all your “buyers” are going to be from the same gender.
A daughter, girlfriend, or mom might be visiting to buy some nice footwear for their father, boyfriend, or son.
I hope you’re getting where we are taking this. You need to have at least a basic understanding of a few marketing concepts like buyers, users, buyer-persona, brand recall, etc., to select and milk those KPIs to their fullest.
Now comes the good stuff you have been waiting for: what tools to choose to get the right picture with real-time traffic analysis. Planning around these three points listed below might do the trick:
Chances are that as your business grows, you or your team might feel the need to shift from one tool to another. But each time you make that move, make sure that the three points above are among your discussions around this topic.
I have compiled a list of 3 top tools that are currently ruling the market of real-time web analytics and have been tested by a large enough pool of users, meaning you don’t have to bother about performance-related issues.

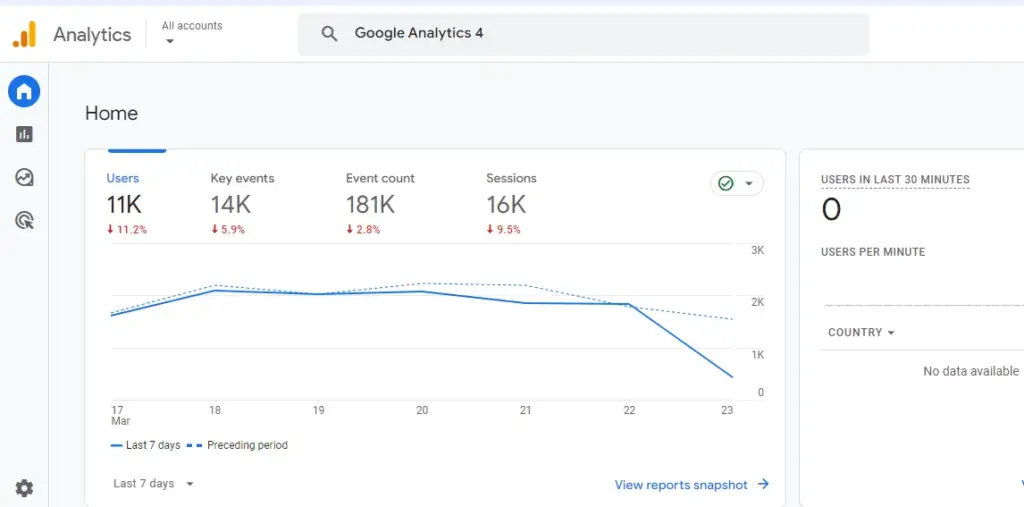
When you’re the biggest search engine in terms of user bases and search volume, you sure do have the muscles to rule the world of web analytics. GA4 (previously Universal Analytics) is undeniably one of the most potent freemium tools out there, loved by droves of users. It is as packed as “packed” comes. Let’s have a quick look at it based on the three factors that we decided above.
As for pricing, here is a snippet from Google AI’s overview when we searched “charges for using GA4”
“Google Analytics 4 (GA4) has two versions: GA4 Standard and GA4 360. GA4 Standard is free, while GA4 360 is a subscription service with higher data collection and processing limits. GA4 360 pricing is based on usage, and the retail price starts at $50,000 per year, which includes 25 million events per month at no extra cost. As you collect more data, your costs increase. GA4 360 also includes enterprise-level technical support and service-level agreements. Enterprise-level customers typically negotiate the agreement directly with Google’s sales team, leading to different prices on a case-by-case basis. GA4 360 is likely to cost $150,000 or more per year. “
The reason we’re not providing the exact plan costs for GA4 is they are sometimes subject to change. And when they do and you find a discrepancy in what you find on GA’s website and here, you might think “Well, this article didn’t age well”.
There is one deluxe version up for grabs for if you have bigger operations, dubbed Analytics 360. To snag an exact price, you’ll need to ring up their sales crew.
Now, when you are the leader and have built a platform packed with so many features, using it can take a toll over many. It’s no different when it comes to GA4.
So much so, that companies have to create dedicated positions, and sometimes even a department, just so they can handle and monitor their real-time traffic analysis.
So if you’re on your own or own a very small team, GA4 might prove to be a steep hill to climb – steeper to conquer.
TL;DR: GA4 is a good tool, follows a freemium model, but tough to understand and manage in its totality.

It’s not an easy task to make a space for yourself when there are so many feature-packed real-time traffic analysis tools in the market already.
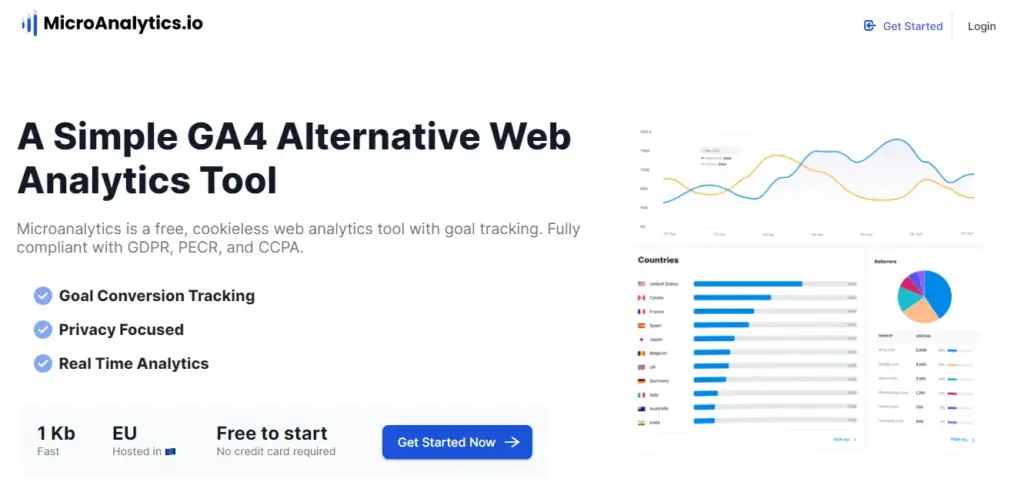
But, MicroAnalytics a privacy focused web analytics tool has done just that by improving on three key factors that people often look for in their next analytics tool: ease of use, pricing, and privacy.
MicroAnalytics is like that friendly neighbourhood web analytics tool that doesn’t mess around with cookies. That’s a pretty good feature to have if you love to keep your business and website secrets with you and you alone.
This cookie feature alone has been responsible for making many business owners and marketers choose MicroAnalytics as an alternative to GA4.
As it has been designed keeping the ease and privacy of users in mind, you’d find that finding your way around the tool is a cakewalk for most of the part. The dashboards are super easy to understand. Setting it up with your website is also way too easy; even for those who are starting out.
MicroAnalytics packs several DIY, easy-to-use features for both new and seasoned marketers, you won’t need a separate team to handle your web analytics tasks, and the plans are priced way lighter than any other web analytics tool.

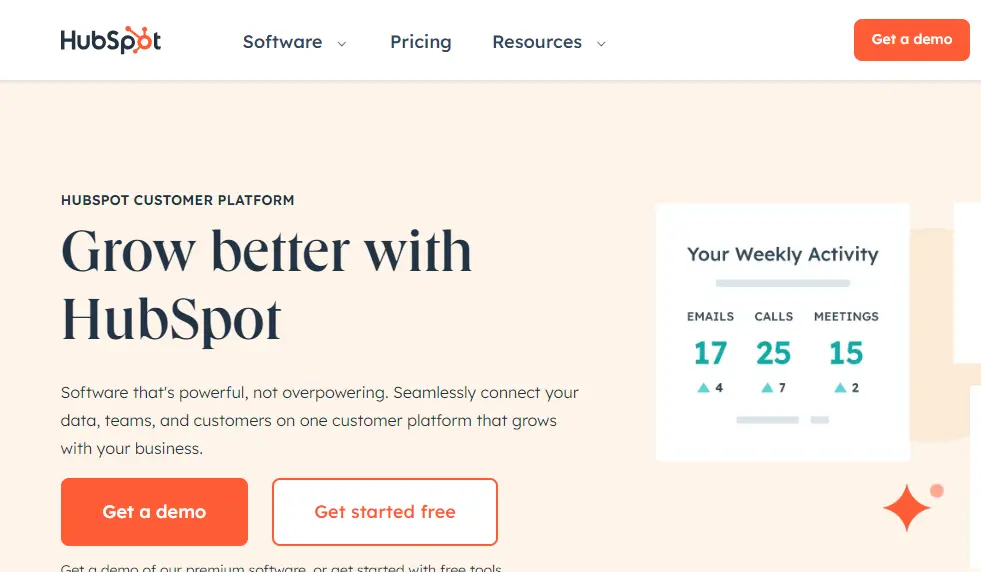
With a humongous user base of over 100,000 individuals, which includes freelancers, marketers, and enterprises, HubSpot is generally known for its CRM and marketing suite.
Its web analytics services are more complementary or add-on in nature rather than being the central part of its services.
The traffic analysis tool delivers in-depth insights into website activity, allowing users to generate customizable reports and dissect data by various parameters such as traffic source, topic groups, and device type.
Like most tools in this genre, HubSpot, too, follows a freemium model. It offers 3 premium plans, the first one starting at $23 per month. If you want to have a go at it, you can avail the 14-day free trial to explore the pros and cons of HubSpot real-time analytics.
Its intuitive dashboard facilitates easy navigation and grants access to a plethora of monitoring options including bounce rates, sessions, visitors, page views, CTA clicks, referrals, and submission rates.
With features like customizable report intervals, data export options, and the use of specified analytics modules, users can streamline their analysis process efficiently.
Hubspot has been here for long, is known mostly for its CRM features, offers a freemium model, comes with a good range of important analytics as well CRM features, but does have a bit of a steep learning curve if you’re just starting out.
If you’re looking for more web analytics tool options, do give this article a read.
Look, setting up analytics on your website can be a little like learning to ride a bike: you start on your own and fall down a few times.
But ask yourself: In today’s competition, can I afford to lose a few months learning from my mistakes while my competitors race ahead in both user acquisition and revenue?
So, why waste time learning from mistakes? Almost all platforms have a support channel where you can reach out to help yourself in setting up the account. Then, of course, there are knowledge-base articles that you can read minutes before the real activity to ensure avoiding silly mistakes.
This can’t be emphasised enough. Events are like those little pop-up notifications that tell you when someone does something cool on your site – like clicking a button, downloading a file, or watching a video.
You might think that tracking your hero section CTA alone would unlock the secret to your website’s success. But no CTA should be looked down upon in this regard.
You never know what works for which visitor. So try tracking not just the top-placed CTAs but also the once placed way down.
This is in line with the first point that we discussed. Goals are like checkpoints you set up for your users, whether it’s making a purchase, signing up for your newsletter, or whatever else you want them to do. They are akin to “business-oriented” KPIs.
Even experienced marketers often fumble when choosing and setting up Goals the right way. An example is setting up transitions made using payments gateways as goals.
One wrong link and you end up setting up “Continue payment” link as your Goal instead of the “Transaction successful” page, a goof-up that might present you with inflated payment figures in a not so far future.
So before you do anything that’s going to have an impact on your revenue figures, either have your concepts clear or ask your platform’s success team to help you out.
By understanding user behaviour as it happens, you gain invaluable insights to shape your website’s performance and drive growth. Whether you’re monitoring product conversions on an e-commerce site or tracking trending topics on a news portal, real-time analysis empowers you to make informed decisions promptly.
Remember, choosing the right KPIs, utilising the right tools, and avoiding common mistakes are essential steps on your journey to real-time success. So, dive in, keep analysing, and watch your website thrive in real time.